


Hi and welcome
Have you wondered how to tell what features influences others in a given experiemnt or analysis? For instance , does the height of individual have any effect o his/her weight or is there any linear relationship between age and salary? In this post i will be explaining one of the tools you can use for this purpose.
Correlation coefficient
This is a statistical measure of the linear relationship between two variables. It shows if variables can actually be related using the formula y=a+bx, where a and b are constants, x and y are the variables or parameters.
Correlation, denoted as r or R lies between 1 and -1 inclusive. There are different degrees of correlation, however they can be broadly classified into positive, negative and no correlation. If the correlation is a 0, then there is no correlation between them. Take note that no correlation does not mean that they are not related, it only means that the correlation between these parameters is not a linear one; there relationship could be exponential , quadratic, e.t.c.
Positive correlation is when the correlation coefficient is positive , i.e it lies between 0 and 1 with 1 being inclusive but 0 is not , while negative correlation is for a negative correlation coefficient i.e between 0 and -1 with 0 not being inclusive but -1 is.
There exists order degrees of correlation as shown below
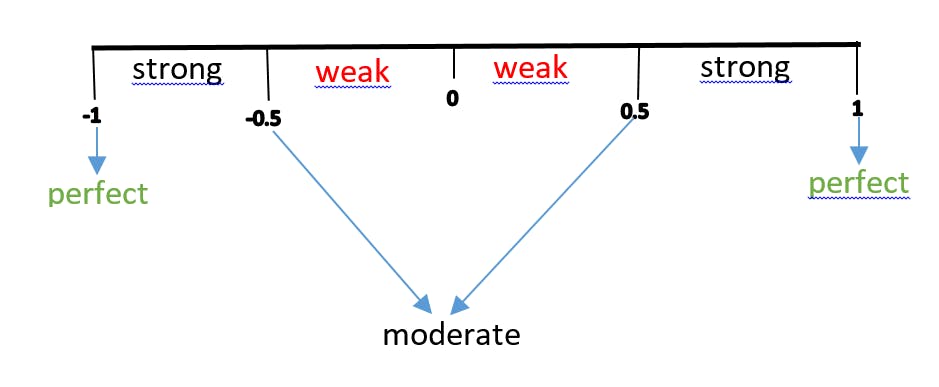
This means a value of 0.73 is a strong positive correlation. Which means the increase in one parameter would lead to a correspondingly increase in the other parameter and same goes to decrease while a value of -0.43 is a weak negative correlation , indicating that as one parameter increases , the other would decrease and vice versa. The former can be seen as a direct variation and the later is an inverse variation.
Determination of Correlation coefficient
There are different methods that can be used to determine the correlation coefficient between two parameters namely pearson's correlation, spearman's rank and kendall's correlation, however in this post we shall be considering the pearson's correlation as it is the most common correlation coefficient measure.
The pearson's product moment correlation (PPMC) coefficient can be calculated using the formula
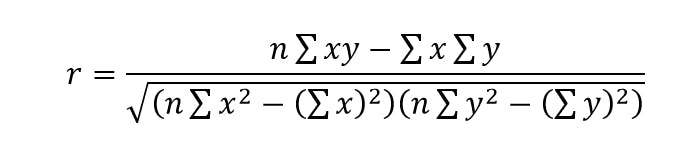
where x and y are the individual values of the parameters X and Y.
Let's consider an example.
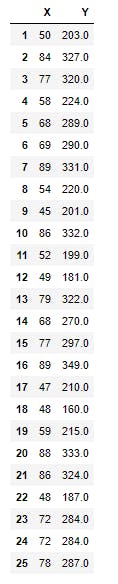
The data below is a simulated data that represents the ages and weights of 25 individuals from a survey. We shall be using numpy , pandas and matplotlib for this illustration. First, let's see how we can perform a semi automated computation for the data. below is the data set and how it was loaded
import pandas as pd
df=pd.read_csv("survey_data.csv")
print(df)
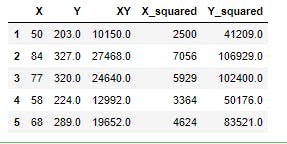
First we have to complete the table by computing the relevant parameters, this will be done with the help of pandas as shown below
df["XY"]=df.X*df.Y
df["X_squared"]=df.X**2
df["Y_squared"]=df.Y**2
print(df.head())
Now , for the numerator of the formula , we have
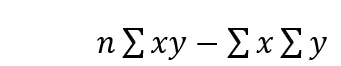 which when implemented in pandas becomes
n=len(df) # gets the number of pairs
r_numerator=n*df.XY.sum()-df.X.sum()*df.Y.sum() # gets the numerator of the PPMC formula
while for the denominator, we have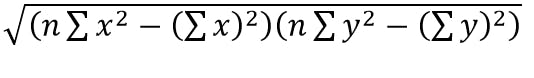 and this can be implemented in pandas as
r_denominator=((n*df.X_squared.sum()-(df.X.sum())**2)*(n*df.Y_squared.sum()-(df.Y.sum())**2))**(0.5)
The final result, i.e the correlation coefficient will be the ratio of this two values in order , i.e r=r_numerator/r_denominator as shown in the snippet below
correlation=r_numerator/r_denominator
print(correlation)
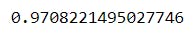
The result shows that there is a very strong positive correlation between X and Y.
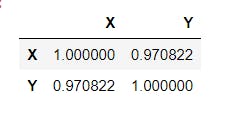
Using the pandas .corr() method
Sorry to take you through the stress. Pandas actally does this computation easily using the .corr() method. This gives a matrix called the dispersion amtrix or the covariance matrix. It shows all possible pairwise combination among the numerical columns of the DataFrame, as shown below
df[["X","Y"]].corr() # Selects the "X" and "Y" columns using fancy indexing then obtains the correlation matrix
The plot for the above data set can be gotten using the pandas library or the matplotlib library as shown below
df.plot.scatter("X","Y")
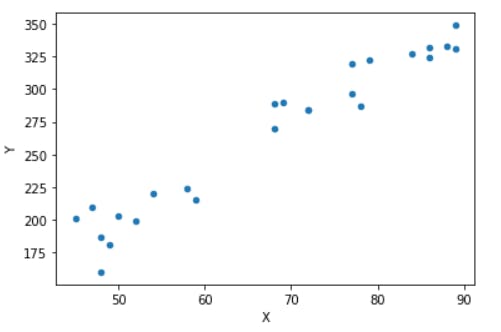
The strong upward trend is a clear indication of the positive correlation between the parameters.
Conclusion
With the knowledge you have now, you have added yet another tool to your data exploratory process. This helps you in feature selection and some other data exploratory or decision making processes. Have a lovely time and stay safe!
This post is part of a series of blog post on the probability and statistics , based on the course Practical Machine Learning Course from The Port Harcourt School of AI (pmlcourse).