

Practical Machine Learning Course Week 3 Highlights; Data Visualization With Matplotlib


Hello, community!
On the 21st of March, the Port Harcourt School of AI had her third class for the Practical Machine Learning course. In our bid to democratize AI and data education and technology, making it accessible to anyone interested, we commit to releasing the highlights of each week’s classes to the general public on our blog and YouTube channel (if we happen to have any video content) so everyone can benefit in some way from the otherwise limited-participants class.
Class Details
Lesson Title: Data Vectorization and Visualization with NumPy and Matplotlib (Series 2).
Guest Facilitator: There was no guest speaker/facilitator for this week.
Class Instructors:
- Boma S. George on "Practical Data Visualization With NumPy and Matplotlib."
Class Facilitator: Stephen Oladele
Class Project for Assessment:
- Learners will harness the power of NumPy and its integration with Matplotlib to visualize data using the popular Titanic dataset from Kaggle.com
- Learners will contribute their own quota of effectively communicating data on the recent coronavirus outbreak (COVID-19) to the general public to help them gain insights from open datasets.
Class Date: 21st of March 2020
Class Time: 10 AM - 4 PM
Class Venue: Loctech IT Training Institute, 4a Etim Okpoyo Close, Rumuobiakani, Bridge bus stop, Aba Express Road, Port Harcourt. You can locate it via Google Maps by clicking here.
Class Agenda: You can access the class agenda here.
You can find the video highlights for this class on our YouTube channel here;
Class Highlights
For every week, we have one of our students to volunteer to write a report for the class, as a means of improving their class awareness and writing skills. You can read last class’ report from Stanley Tochukwu, and you can read it here.
The class started off following the agenda with Stephen Oladele giving an overview of the hosts (Port Harcourt School of AI community) of the program and other addresses, and what to expect from the class on that day in what we tagged the "introductory session" as a way to ease learners into the week's class, and as well bring the power of trust and play to the classroom. We had learners introduce their seat partners and get to know; who they are, what they do, what they expect from the course, as well as one thing they found faulty about the training they attended or their formal education. We got a lot of insights into what the learners hated about the training they attended, as well as their formal education.
Main Point
We discovered that most of the faults noted were common between every one of the learners and for us it all boiled down to making sure the learning or education is inclusive.
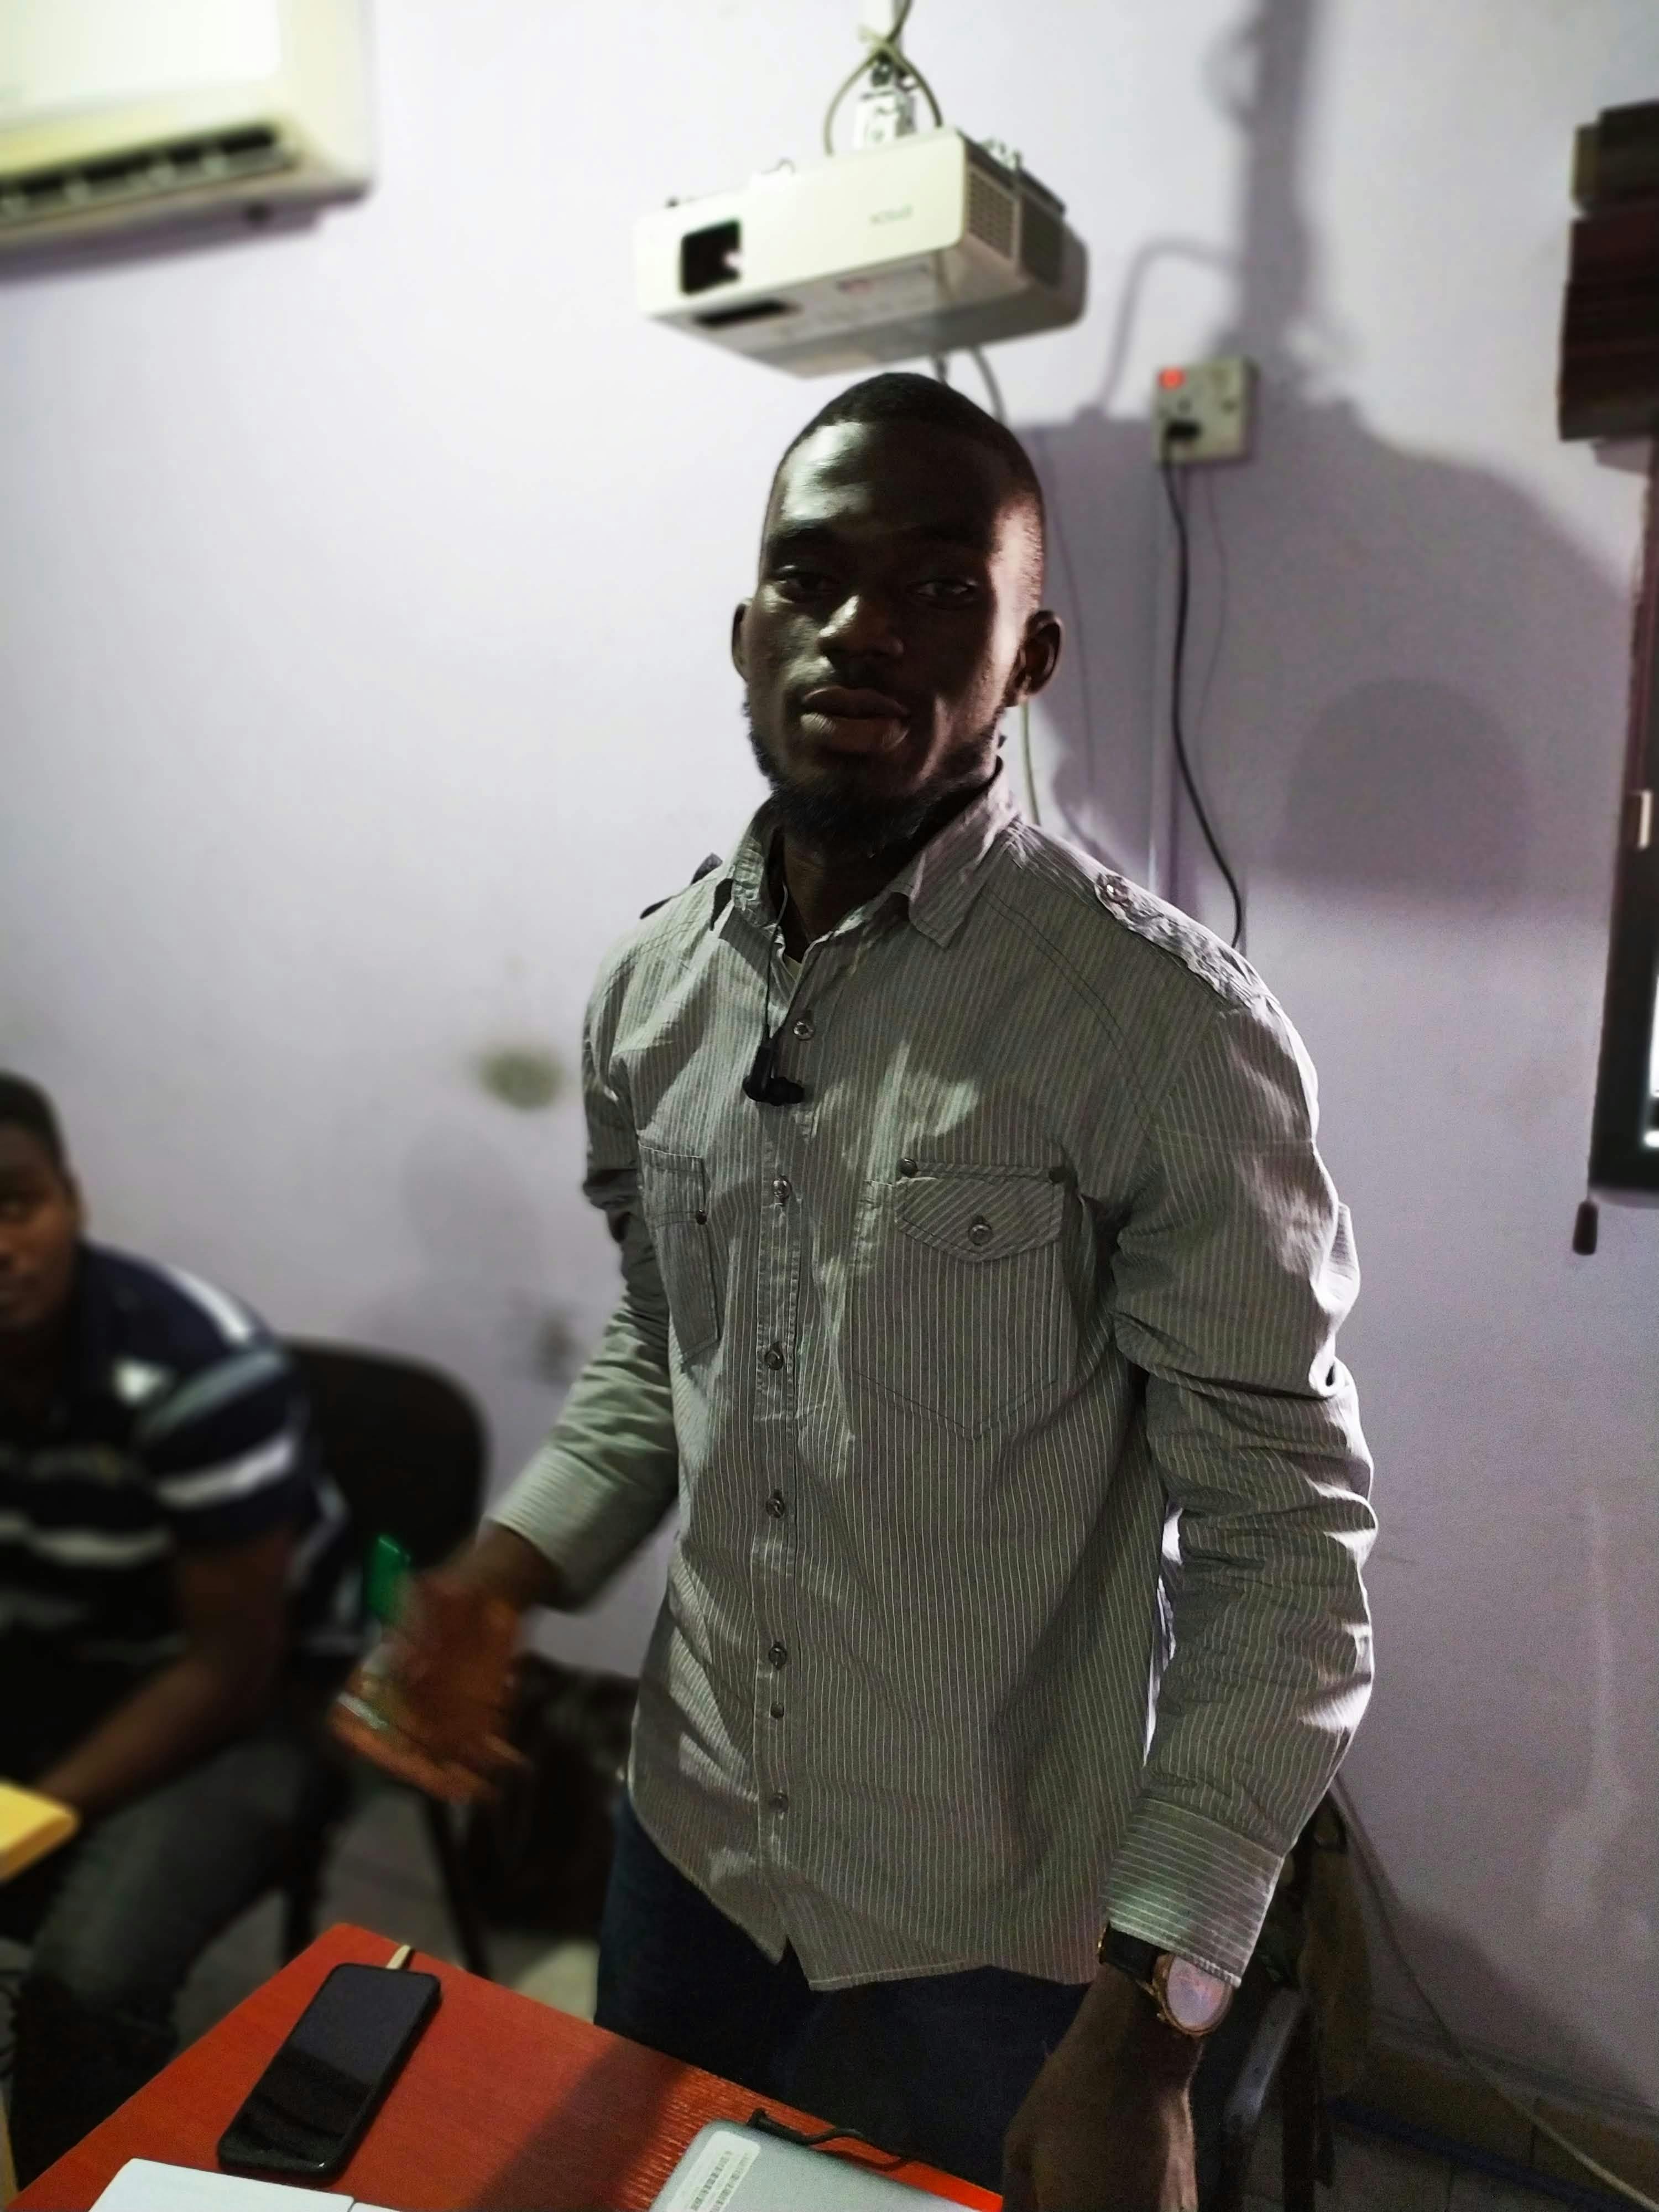 A photo of Henry introducing his partner Gilead to the class.
Practical Workshop On Data Visualization Using Matplotlib; Visualizing A Dataset On The COVID-19 Pandemic For Insights and Effective Communication.
Boma S. George, the instructor for the class, guided the students through the workshop in using their knowledge of NumPy and Matplotlib (without the used of the Pandas library, yet) to visualize the answers to some posed questions on the used dataset.
It was a very hands-on session with participants also coding along with the instructor to try and answer some questions so as to communicate insights from the otherwise structured dataset (you can find the dataset used in class here). Participants were later given a class project assessment to create other types of aesthetic and insightful plots that they can use to effectively communicate the data to the public.
You can find the link to the instructor code repository here.
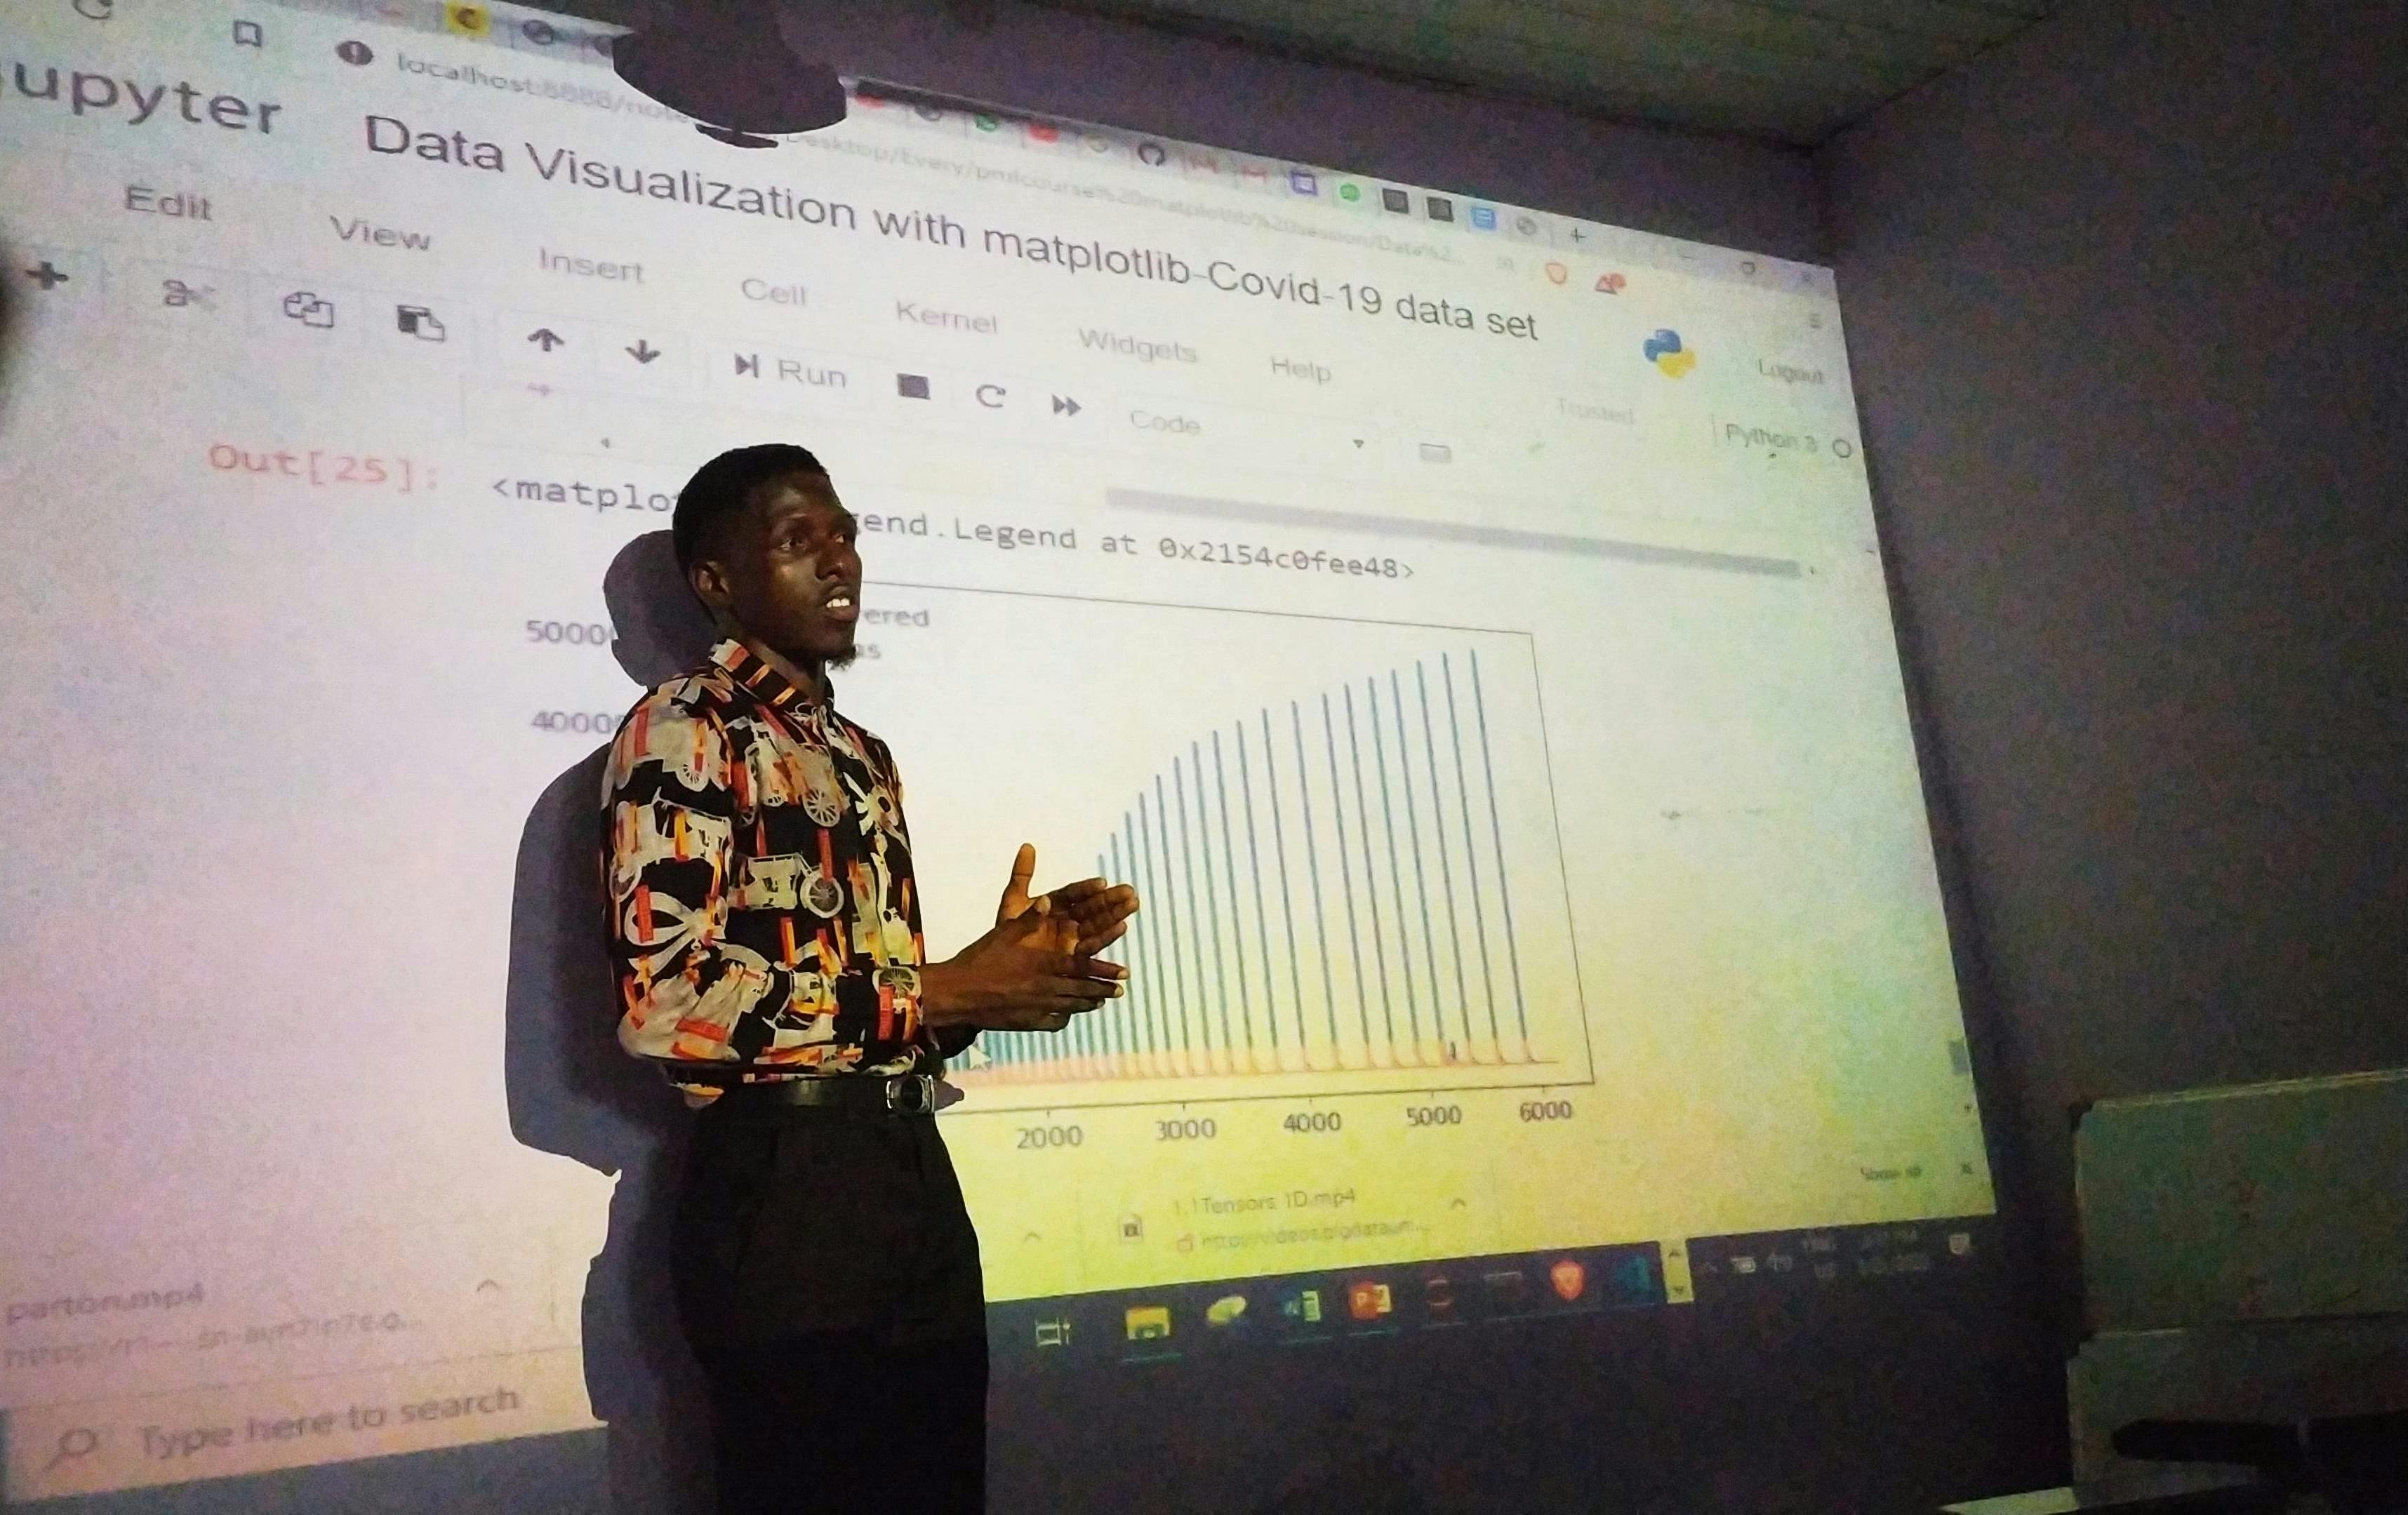 Boma S. George facilitating the workshop on data visualization.
Practical Workshop On Data Visualization Using Matplotlib; Visualizing The Popular Titanic Dataset.
The class then continued after the lunch break for participants. The participants went on to visualize the popular Titanic dataset as a way of putting their knowledge of Matplotlib into practical use. They got to learn more about other types of visualization techniques for more plots and charts that are relevant to that problem.
You can find the link to the instructor code repository here.
Classes Continue Next Week…
The next class will be moved completely online for course registrants in our bid to make sure we abide by state policies and place the safety of learners first. We will also stream the workshop from next class guest speaker Olalekan Akinsande, the technical delivery lead and data scientist at Data Science Nigeria. He will be speaking on the topic "Machine Learning: What Happens When You Do Not Explore Your Data". The link will go live on Saturday. You can follow our social media pages for more; Twitter and YouTube channel.
Class Sponsors and Enablers
Thanks to LocTech IT Training institute for supporting us with their facility as the venue for last week’s class. You can visit their website here, for your professional and accredited IT certifications.
Thanks to everyone who showed up for the classes. See you next week.
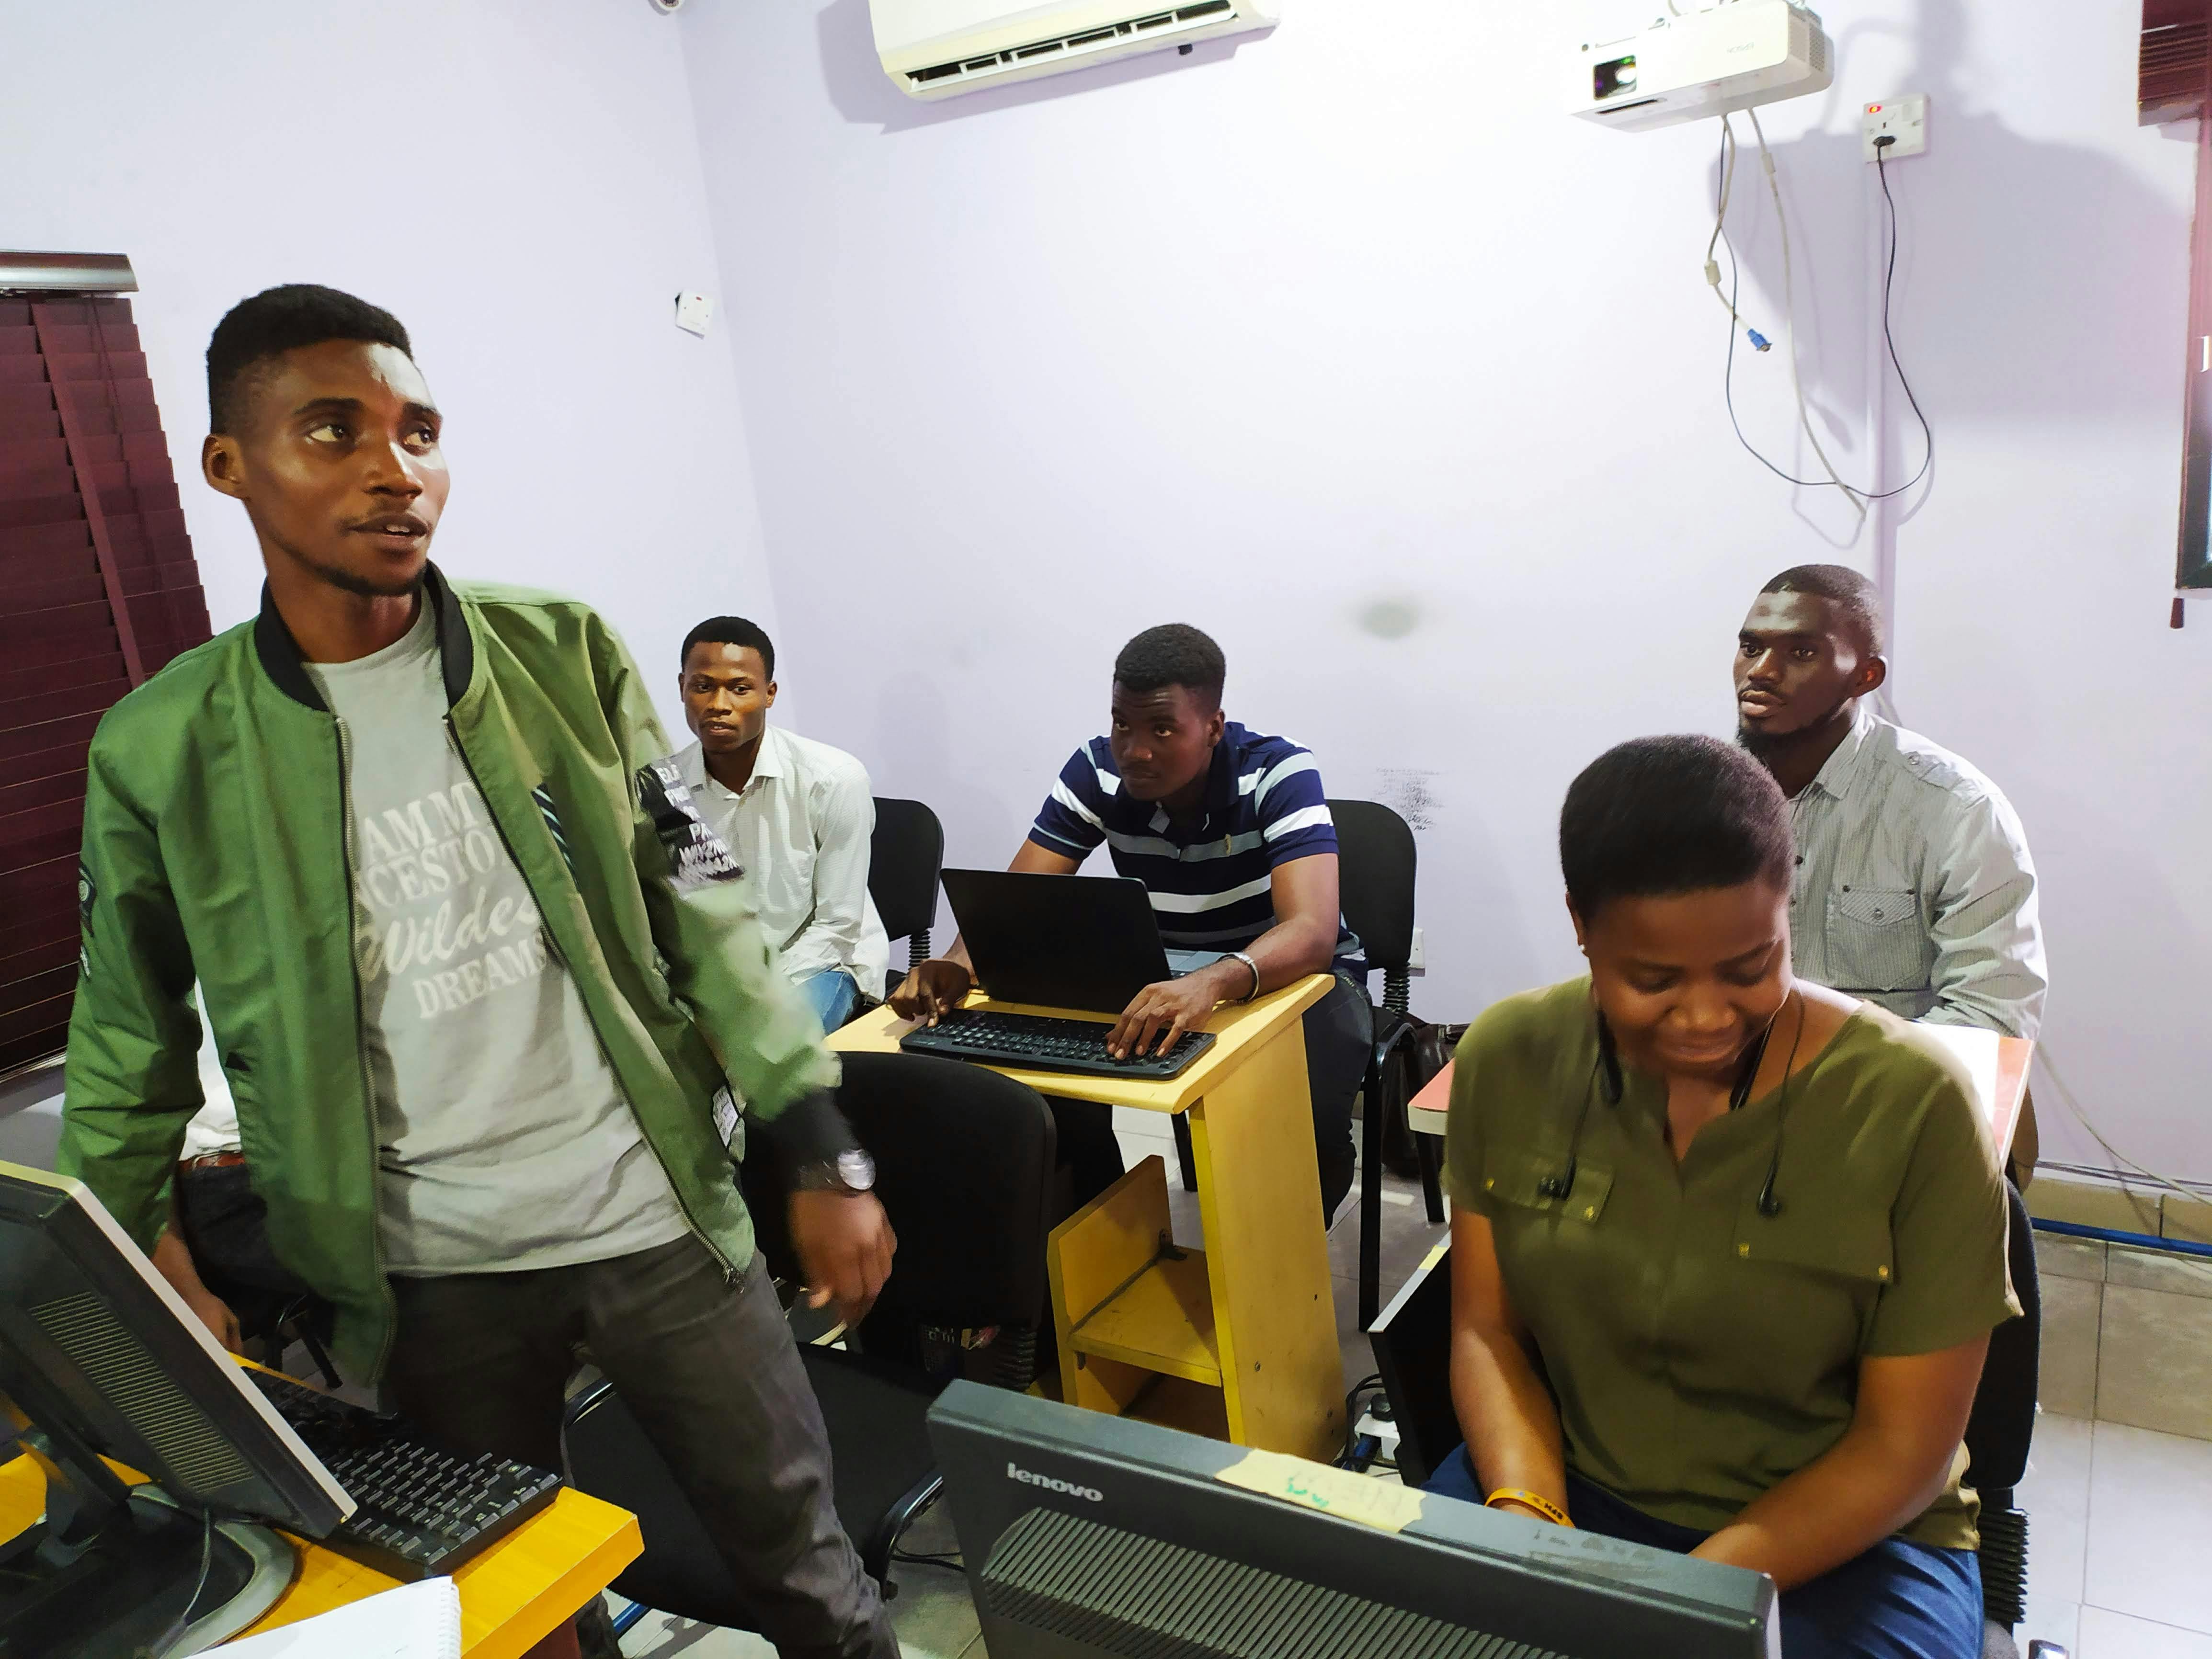 Learners engaging in class.
Other Community Initiatives Ongoing
We are seeking sponsorships to keep on running our classes.
We need funds to keep on running our classes and exploring new grounds. If you are interested in sponsoring us, please mail us portharcortschoolofai@gmail.com or send us a DM on Twitter.
March Calendar and Timeline
You can now read our timeline for the month of March here and subscribe to our calendar by clicking here. If you do not use Google Calendar, you can click this link to access the calendar in your web browser.