Hi and Welcome
This is the second post, on my series of posts on the pandas library. In the previous post, we went through the pandas Series object, which is one of the two main objects in pandas. In this post we shall be considering the following:
- What is a DataFrame
- Different ways of Creating DataFrames
- How to change the default columns that comes with a DataFrame
- How to Work with the .head() and .tail() methods
- How to work with common methods and attributes in pandas
Are we excited already? Let's get started!!
What is a DataFrame?
A DataFrame can be seen as a multidimensional array of items with labels. For a two dimensional array, it can be seen as a table of values, where each row has an index and every column has a column name. A row is more like a record in a database and the columns are the fields. The point of intersection of a row and a column is a cell or data item. DataFrames are rich in methods that makes working with data fun and easy, as will be seen in this post and the ones to come.
Different ways of Creating DataFrames
There are a couple of different ways to create a DataFrame. In this section , i shall be going through the common ones.
DataFrame from Python multidimensional list
A multidimensional is a list of lists, which can be seen as a matrix or table.
In this , each sub-list is seen as an observation, i.e a row and each of its element is seen as a column element. It can also be viewed as a matrix. To create a DataFrame , we use the pandas .DataFrame() method, as shown below
1    import pandas as pd
2    x=[[4,5], [6,7], [1,4]] # Python list, having three sub-list.
3    data=pd.DataFrame(x) # creates a dataframe from the list  x
4    print(data)
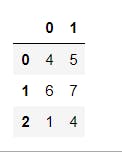
Since there are 3 sub-lists, hence we have 3rows. each sub-list has 2 entries, hence we have 2 columns. Each row can also be seen as a record, while each column is seen as feature or a field(if you have worked with databases, then this terms should be familiar).
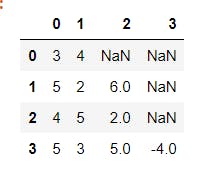
It is also possible to create a DataFrame from a list of lists in which all lists are not of equal length. for instance y=[[3,4], [5,2,6], [4,5,2], [5,3,5,-4]]. In this , the number of observations of the DataFrame becomes the maximum length of the sub-lists and the missing values in each sub-list gets a value of NaN. NaN is a special object that denotes the unavailability of a value or item; such values are called missing values. This is as shown below
1    import pandas as pd
2    y=[[3,4], [5,2,6], [4,5,2], [5,3,5,-4]] # Python list, having four sub-lists.
3    data=pd.DataFrame(y) # creates a dataframe from the list  y
4    print(data)
DataFrame from NumPy ndarray
This is yet another means of creating a DataFrame. Since pandas is built on top of NumPy, the compatibility is superb. This is as shown below.
1    import pandas as pd
2    import numpy as np
3    np.random.seed(12) # sets a random state, hence making the output of the next line deterministic
4    x=np.random.randint(2,30, (3,4)) # generates a  3 by 4 dimensional NumPy array
5    data=pd.DataFrame(x) # Transforms x to a dataFrame with 3 rows and 4 columns
6    print(data)

DataFrame from python dictionary
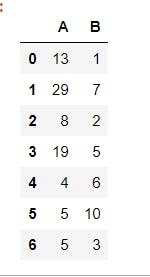
Python dictionary is another appropriate means of generating a pandas DataFrame. In this, The keys becomes the column names and the values becomes columns, as shown below. The data used in this example is generated using the NumPy random module. The data set represents the weights and heights of 7 individuals
1    import pandas as pd
2    import numpy as np
3    np.random.seed(12)
4    data=pd.DataFrame({"Weights":np.random.randint(40,90,7), "heights": np.random.randint(4, 8, 7)})
5    print(data)
DataFrame from pandas Series
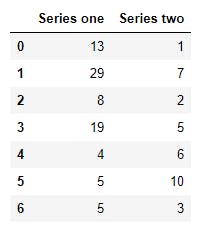
DataFrame can also be created from pandas Series. In this situation, each Series becomes a column of the DataFrame. Also pay close attention to the indices of the Series, as this is also taken into account., that is, if the series all have the same indices, then the alignment would be smooth, however if the indices are not the same, then the union of the series would be taken as the index column and the records laid out appropriately.
1    import pandas as pd
2    import numpy as np
3    np.random.seed(12) # sets a random state, hence making the output of the next line deterministic
4    series1=pd.Series(np.random.randint(2,30, 7)) # generates a  series from a NumPy array
5    series2=pd.Series(np.random.randint(1, 13,  7) ) # generates a  series from a NumPy array
5    data=pd.DataFrame({"Series one":series1, "Series two":series2})
6    print(data)
DataFrame Columns
You must have noticed that in the first set of DataFrame, the columns are given the default values of 0,1,2,.... These values can be changed either while creating the DataFrame or after the DataFrame has been created. First, let's do this after creating the DataFrame.
1    import pandas as pd
2    import numpy as np
3    np.random.seed(12) # sets a random state, hence making the output of the next line deterministic
4    x=np.random.randint(2,30, (3,4)) # generates a  3 by 4 dimensional NumPy array
5    data=pd.DataFrame(x) # Transforms x to a dataFrame with 3 rows and 4 columns
6    print(data)

Notice the columns of the data are labeled 0,1 and 2; these values can be changed by using the .columns attribute, as shown below.
1 data.columns=["A", "B", "C", "D"] # changes the columns of the DataFrame
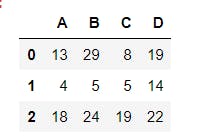
We can also change the columns at the point of creation, by specifying a list or tuple for the columns parameter, as shown below
1    import pandas as pd
2    import numpy as np
3    np.random.seed(12) # sets a random state, hence making the output of the next line deterministic
4    x=np.random.randint(2,30, (3,4)) # generates a  3 by 4 dimensional NumPy array
5    data=pd.DataFrame(x, columns=["A1", "A2", "A3", "A4"]) # Transforms x to a dataFrame with 3 rows and 4 columns and assigns label to each column.
6    print(data)
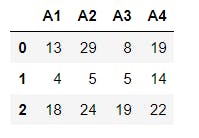
Note that i did not discuss the index method here since it is pretty much the same process as that of pandas Series discussed in my last post
DataFrame methods and attributes
Now a DataFrame object is packed with a lot of methods and attributes that can be used to view the structure and manipulate data. .index and .columns are among the useful attributes. In this section, i will be going through other useful methods and attributes.
Viewing the data set using the .head() and .tail() methods
To view the data set, what we have being doing so far is to print the data. This method have been working so far for us, since we have being working with a very small chunk of data, but most times, our interest might not be to see the entire data set but the first few rows/records or the last few records. To do this, two useful methods that are used are the .head() and the .tail() methods. The .head() method, when used on a DataFrame, shows the first five records of the DataFrame while the .tail() method shows the last five rows of the data, however you can be in control of how many records are shown by passing in the number of rows as an argument to the methods. These concepts are illustrated below.
1    import pandas as pd
2    import numpy as np
3    np.random.seed(12) # sets a random state, hence making the output of the next line deterministic
4    x=np.random.randint(2,30, (20,4)) # generates a  20 by 4 dimensional NumPy array
5    data=pd.DataFrame(x, columns=["A1", "A2", "A3", "A4"])
6    print(data)
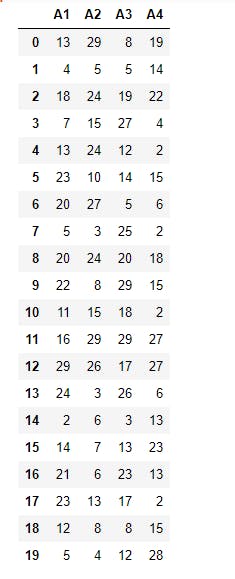
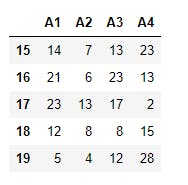
This is the usual output. If we use the .head() method, we get the result below
7 print(data.head())
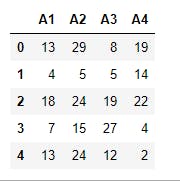
And using the .tail() method, we get the result below
8 print(data.tail())
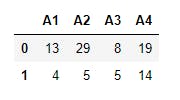
To view the first 2 records, we use
9 print(data.head(2))
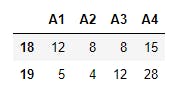
To view the last 2 records, we use
10 print(data.tail(2))
Describe and Info methods
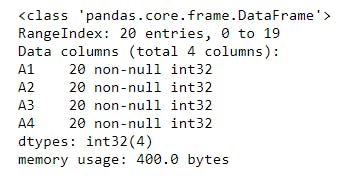
To see a summary of the data set , in terms of the memory it occupies, the data type of each column, the number of available items on each columns, e.t.c, we use the .info() method, as shown below
11 print(data.info())
And the output is
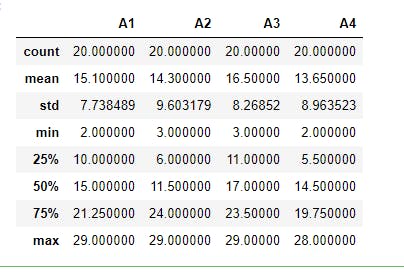
To obtain a statistics of the data, in terms of the mean, the percentiles, maximum value of each column, e.t.c, we use the .describe() method, as shown below
12 print(data.describe())
Common attributes
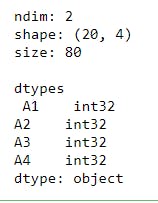
The most common attributes of the pandas DataFrame are : .ndim: It gives the dimension of the DataFrame. This will be 2 in most cases. .shape: This gives the number of rows and columns of the DataFrame .size: This gives the total number of data items that the DataFrame can hold. This is the product of the entries returned by the .shape method. .dtypes: This gives the data types of all the columns in the DataFrame
These are as shown below
13    print("ndim:",data.ndim)
14    print("shape:",data.shape)
15    print("size:",data.size)
16    print()
17    print("dtypes\n",data.dtypes)
The output is
Conclusion
Hope you're having a nice time with pandas? We yet have more good tidings to come. Watch out for the next post. Cheers!
This post is part of a series of blog post on the Pandas library , based on the course Practical Machine Learning Course from The Port Harcourt School of AI (pmlcourse).

