


Hi and welcome
This is my 4th post on my series of posts on the pandas library in python. To go through the first post click here , for the second post click here and here for the third .
In this post we shall be considering the follow
- How to make selection in Pandas Series objects
- How to Select Columns in Pandas DataFrame objects
- How to select a cell in Pandas DataFrame object
- How to select a row in Pandas DataFrame object
Let's get going, shall we?
We know that when a DataFrame or Series Object is created, it comes with a default index which is the rangeIndex, i.e it starts labeling from 0,1,2.... Same goes for the column index. The question is how can one specify that he or she wants to select a row and not a column, since they both have same default indexing. First, let's consider indexing in Series:
How to make selection in Pandas Series object
Now, as we already know a Series object has only one axis, the row axis, hence selection is done based on this axis only. Now, let's have the data set below, which is the ages of 10 students that were nominated for a dancing competition. The ages of the students lies between 16 and 22 years, as shown below
1    import numpy as np
2    import pandas as pd
3    np.random.seed(5)
4    series1=pd.Series(np.random.randint(16,23, 10)) # randomly generated ages of 10 students between 16 and 22
5    print(series1)
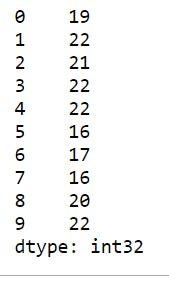
Selection from the above data set wont really be an issue, since we can treat it as a list.
Let's make some selections
6    print(series1[1])# selects the item at index 1
7    print(series1[7])

The output seems to be consistent with what is expected.
Let's select a range of values
8 print(series1[2:6]) # selects items from index 2 to 5
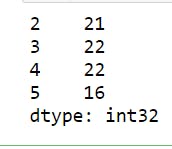
This also turns out as expected, but take note that negative indexing is not supported here.
Ok, let's rename the indices and see the options pandas offers.
9    series1.index=range(1,len(series1)+1) # renames the indices to start from 1
10    print(series1)
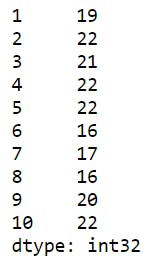
Now, let's repeat those selections
11    print(series1[1])
12    print(series1[7])

The output is consistent with the new indices. It printed the data at index 1 and 7 respectively. But, wait a minute, will the output still be consistent for a range of values? Let's find out
Let's select a range of values
13 print(series1[2:6])
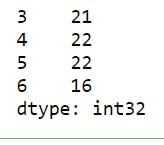
Did you notice that? This is meant to give us the result 22, 21, 22, 22, which are the values at the indices 2, 3, 4 and 5 respectively, instead it gave us something else. Now, what's happening is that when we select an item, it uses the obvious index(explicit index), however when we try to slice or get a sub-series, it uses the default index(i.e the rangeIndex or implicit index). This behavior may not be what you want; not being able to some how predict what is to come, hence there are ways to specify what index you want to use. Here comes the .loc, .iloc and the .ix methods.
.loc() attribute
This attribute allows you to always use the explicit indices; which mean you always get to use the names you specified for both indexing and slicing.
Below are illustrations of this.
14 print(series1.loc[4]) # prints the data at the explicit index of 4

Let's select a range of values with this
15 print(series1.loc[2:6])
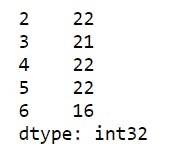
The above output shows that the explicit index is being used but the last index(6) is also inclusive. This is not the case when the implicit index is used in slicing. Take note of this behavior.
.iloc() attribute
This attribute allows you to always use the implicit indices. This means it will ignore the labels showing and use the default behavior, as though you didn't change the index.
Below are illustrations of this.
16 print(series1.iloc[7]) # prints the data at the implicit index of 7

Let's select a range of values with this
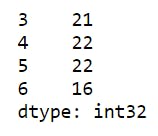
17 print(series1.iloc[2:6])
Selection in DataFrames
Unlike Series where selection is done based on just one axis, the row axis. In DataFrame, selections are done on both axes, the row and the column axes. There are different ways to make selections from a DataFrame.
How to Select Columns in Pandas DataFrame objects
Columns are also called features or fields. Each filed is a pandas Series and can be treated as the value of a python dictionary; which means the column name is the key and the values in that column are the values. Furthermore, once a DataFrame is created, each column becomes an attribute of the DataFrame object , hence the dot operator for objects can also be used, as illustrated below:
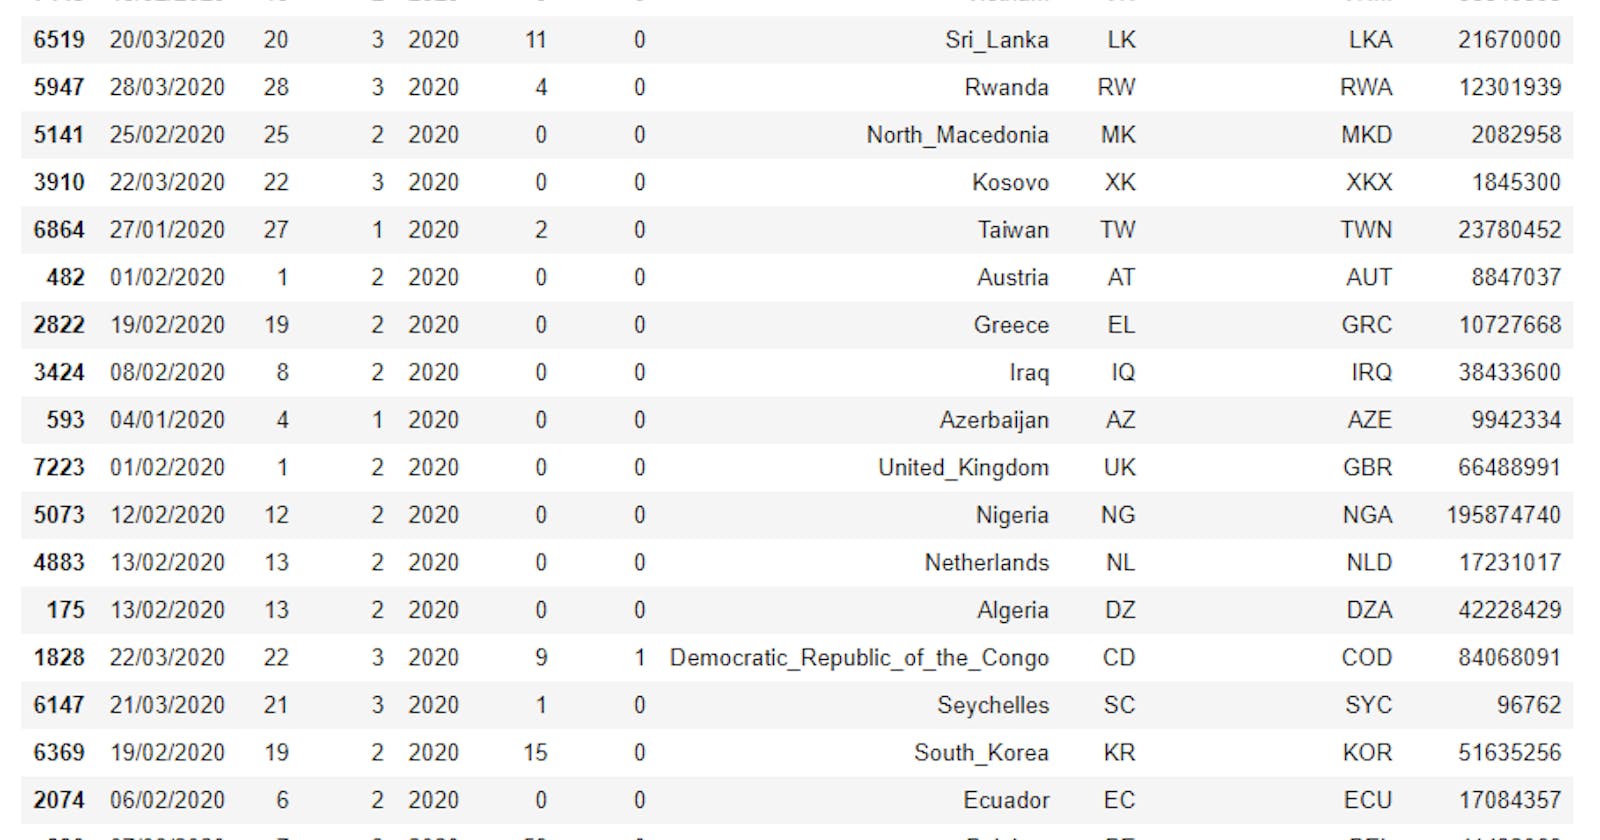
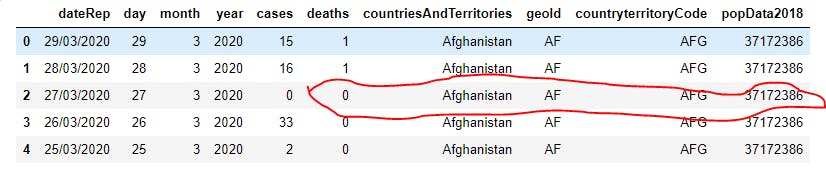
In this example, we shall be using a data set, which is a report on the present pandemic, at the time of writing this post(COVID-19). The report is gotten from European Centre for Disease Prevention and Control website . The data is updated daily based on reported cases of the pandemic and the latest date of report is 29/03/2020.
The data is downloaded in excel format, hence we shall be using the .read_excel() method to get it in.
1 import pandas as pd
2 df=pd.read_excel("COVID-19-geographic-disbtribution-worldwide-2020-03-29.xlsx")
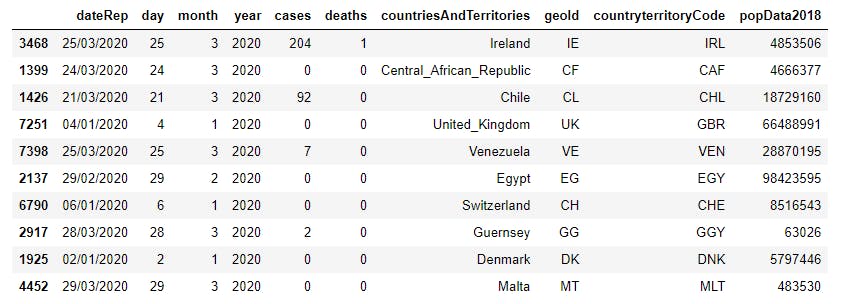
3 print(df.sample(20)) # randomly selects 20 records from the data set to display.
The output is as shown below
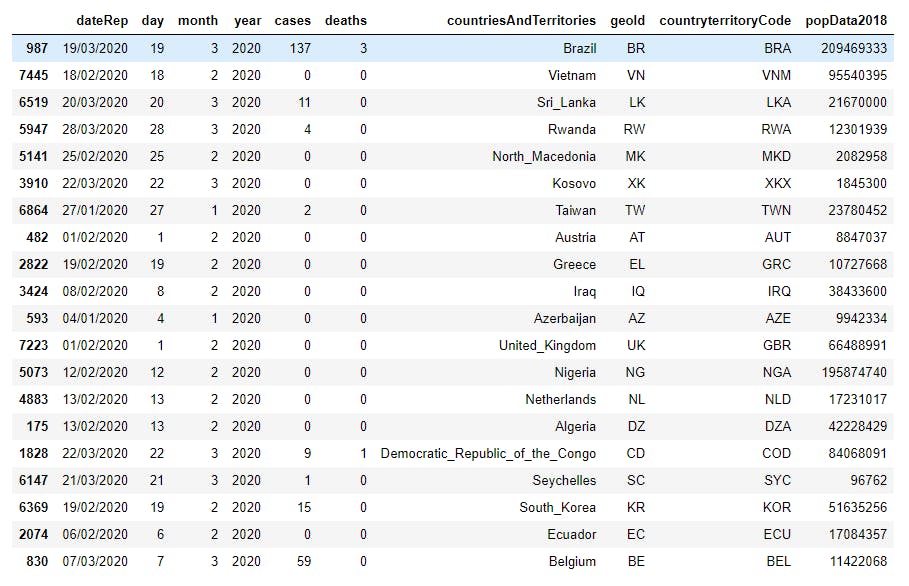
Note that your sample might be different from this, since it is random. A random state can however be set. This is shown below but this time with 10 randomly selected values:
4 print(df.sample(10,random_state=12))
Now, each column can be seen as an attribute and the DataFrame can be seen as a dictionary with columns being keys. Let's make some selections. First, let's see the data type of each column and some other matadata using the .info() method
5 print(df.info())
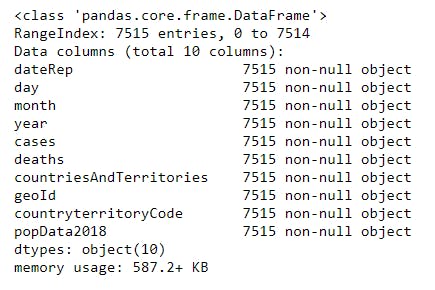
Notice that all columns are seen as objects and this is not meant to be the case, since deaths is meant to be an integer. Selecting the deaths column as converting this to an integer will be a good first step. Let's do that using the dot notation:
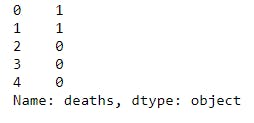
6    df_deaths =df.deaths # selects the deaths column using the dot notation
7    print(df_deaths.head() ) # prints the first 5 records
Next, let's perform the same operation using the bracket/indexing notation:
8 print(df["deaths"].head())
In the code snippet above, since the selection returns a pandas Series object, we performed method chaining on this by calling the .head() method on the result which gave the same result as using the dot operator.
In the code snippet below, we made the selection, converted the data type to integer , then replaced the deaths column. finally printed the total number of deaths.
9    df.deaths=df.deaths.astype("int")
10   total_deaths=df.deaths.sum()
11   print(total_deaths)

Though both method works in selecting columns, the bracket notation is more general since it can accommodate variables and column names with two or more words separated with any character.
How to select a cell in Pandas DataFrame object
To select a cell, i.e a data item, we can either use the .loc or .iloc attributes. The .ix attribute will be deprecated soon, hence will not be discussed.
Another method that can be used is to select a column, whic returns a Series object, then select a particular index from the series item. These are illustrated below
First, let's use the .loc method. recall that the .loc attribute is used to expose the explicit axes names, hence we get to use the labels as they appear in prints. To select the cases for the 2nd record, we use df.loc[1,"cases"]. This shows that we follow the structure df.loc[row_index,column_index]
1 print(df.loc[1,"cases"])

To select that same item using the .iloc method, we have
2 print(df.iloc[1,4])
The first value remains the same, since the default row indices are 0,1,2,3,4,... , which happens to coincident with the explicit indices in the output, however notice that 4 is used for the column, since on counting the column labels, cases falls in index 4, counting from 0.
The third method is to select a column , then the index in question. This is left as an exercise for the reader. Chat me up or leave comments if necessary.
How to select a row in Pandas DataFrame object
To select rows, we just have to modify on any of the first two methods discussed above for selecting cells. This is done by using the colon(:) operator, as shown below
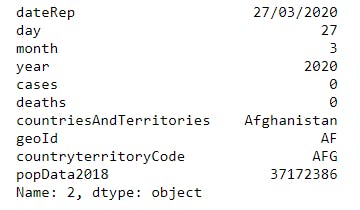
3 print(df.loc[2,:]) # This selects every column of the 3rd record, i.e index 2
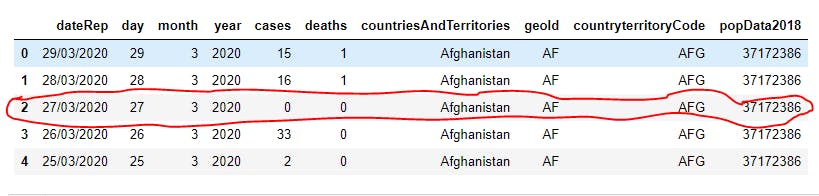
The result is a pandas Series object, which is as shown below
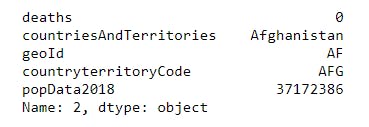
One may also wish not to select all columns but a subset of the columns. In the code snippet below, i selected from the column labeled deaths to the last column popData2018 inclusive.
4 print(df.loc[2,"deaths":"popData2018"])
 The output is as shown below
The .iloc attribute can also be used to make these selection. Work on that and comment on your result, observation or difficulties.
Conclusion
In order for the post not to get too long, we are going to end this post here. In this next post, we shall be looking at how to select multiple records and columns, how to make use of fancy indexing and masking(boolean) selection. Have a lovely day and stay safe.
This post is part of a series of blog post on the Pandas library , based on the course Practical Machine Learning Course from The Port Harcourt School of AI (pmlcourse).